Powerline by Steven Hayward 5/3/2023
The chart below is hard to understand just from a glance, but it is legendary in California energy circles as the “duck curve.” We’ll try to decode what it means. Basically it displays California’s electricity supply and demand minus solar and wind power—that is, it displays demand and supply from conventional sources like natural gas-fired plants, nuclear, hydro, and other sources. In 2015 the shape of the curve looks like a duck’s back. By 2023, the curve looks like a duck with a distended stomach, or perhaps a canyon.
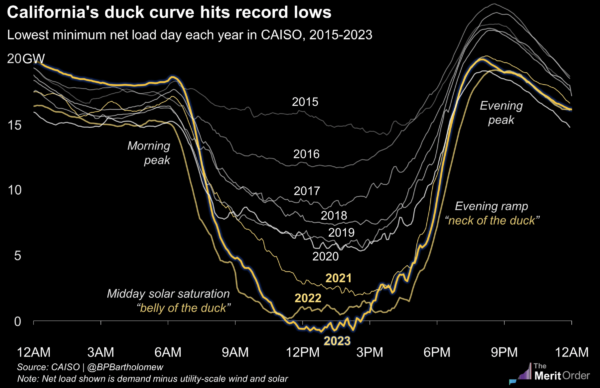
As California has been installing more and more utility-scale solar power, we are now to the point where in the middle of an average sunny day California can meet its electricity demands wholly from wind and solar power. In fact we sometimes have surplus power that suppliers actually pay customers (and other states) to take. Great!, say the greenies. The problem is evident from the duck’s neck, as electricity demand typically peaks in the evening when solar power production falls to zero—duh—and wind power is unreliable. That’s when California has to switch on its gas plants and other conventional sources.
Because of the favoritism and mandates in favor of wind and solar power (wind power can sell its output for negative prices and still make a profit because of the production tax credit), conventional suppliers can’t sell their product mid-day but are expected to be ready to bail us all out every night. (Given that California’s one remaining nuclear power plant, Diablo Canyon, has to run 24/7 and generates nearly 10 percent of California’s total electricity, the solar output mid-day merely displaces Diablo’s output and thus doesn’t actually provide that much reduction in carbon emissions, which is the main point of solar.) And because you can’t switch on a gas plant like a light switch, many of them have to operate all day long anyway, which means the duck belly also isn’t delivering that much reduction in emissions.
More:
https://www.powerlineblog.com/archives/2023/05/the-daily-chart-if-it-quacks-like-a-duck-curve.php

