SHORT-TERM ENERGY OUTLOOK
https://www.eia.gov/outlooks/steo/report/index.php...
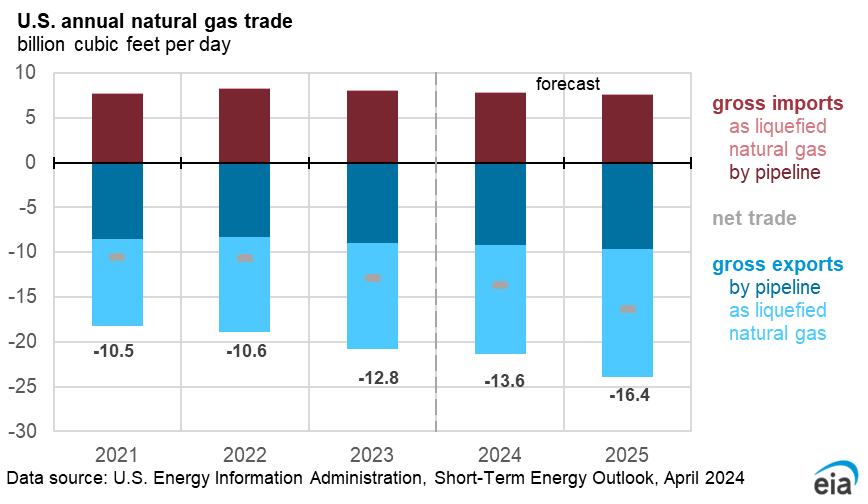
* EIA data show that the United States exported 90,000 b/d more total crude oil and petroleum products in September than it imported. This is the first month recorded in U.S. data that the United States exported more crude oil and petroleum products than it imported. U.S. imports and exports records of crude oil and petroleum products started on an annual basis in 1949 and on a monthly basis in 1973. EIA expects total crude oil and petroleum net exports to average 570,000 b/d in 2020 compared with average net imports of 490,000 b/d in 2019.
* EIA expects U.S. crude oil production to average 13.2 million b/d in 2020, an increase of 0.9 million b/d from the 2019 level. Expected 2020 growth is slower than 2018 growth of 1.6 million b/d and 2019 growth of 1.3 million b/d. Slowing crude oil production growth results from a decline in drilling rigs over the past year that EIA expects to continue into 2020. Despite the decline in rigs, EIA forecasts production will continue to grow as rig efficiency and well-level productivity rises, offsetting the decline in the number of rigs.
* EIA estimates that propane inventories in the Midwest—Petroleum Administration for Defense District (PADD) 2—were 22.0 million barrels at the end of November, 17% lower than the five-year (2014–18) average for the end of November. Colder-than-normal temperatures and strong grain drying demand in November contributed to large draws on Midwest propane inventories. Also, Western Canadian rail shipments of propane to the Midwest have declined since the opening of a new propane export terminal in Western Canada in May. EIA forecasts Midwest inventories at the end of March will be 32% lower than the five-year (2015–19) average and the lowest for that time of year since 2014.
Natural gas
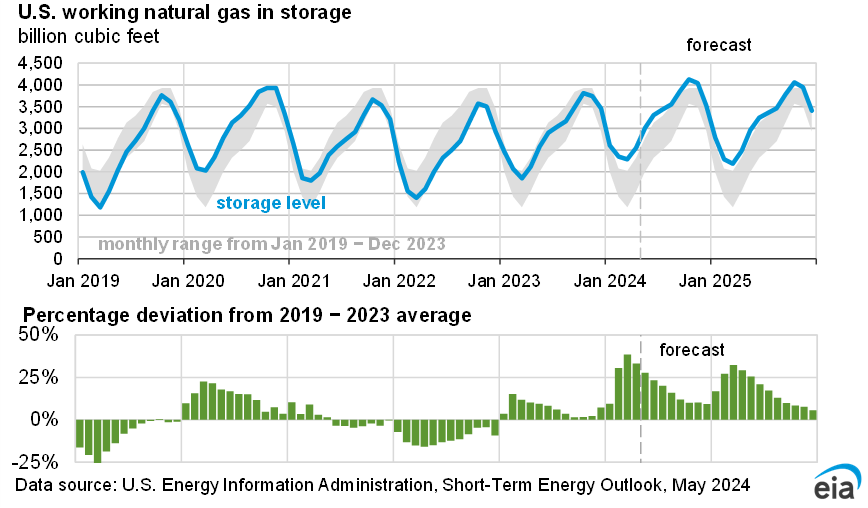
* EIA estimates that the U.S. total working gas inventories were 3,616 billion cubic feet (Bcf) at the end of November. This level was about equal to the five-year (2014–18) average and 19% higher than a year ago. EIA expects storage withdrawals to total 1.9 trillion cubic feet (Tcf) from the end of October to the end of March, which is less than the five-year average winter withdrawal. A withdrawal of this amount would leave the end-of-March inventories at almost 1.9 Tcf, which would be 8% higher than the five-year (2015–19) average.
* The U.S. benchmark Henry Hub natural gas spot price averaged $2.64 per million British thermal units (MMBtu) in November, up 31 cents/MMBtu from October. Prices increased as a result of November temperatures that were colder than the 10-year (2009–18) average. EIA forecasts the Henry Hub spot price to average $2.45/MMBtu in 2020, down 14 cents/MMBtu from the 2019 average.
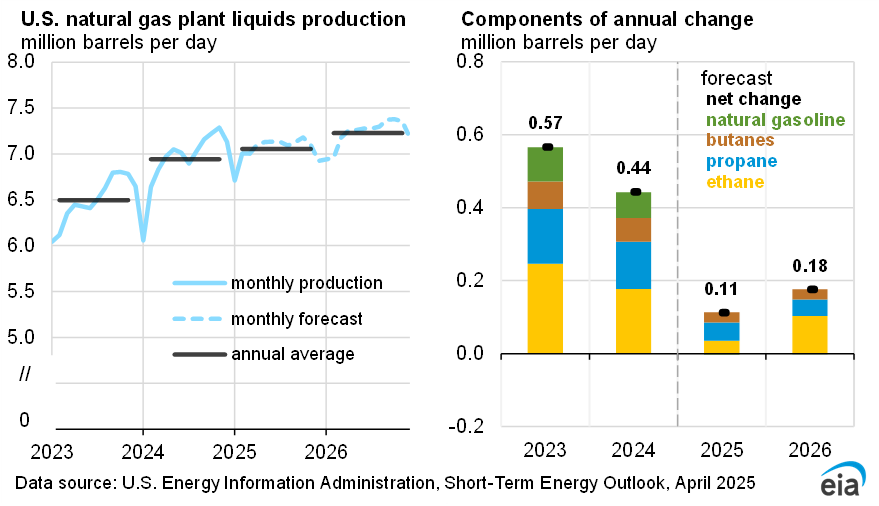
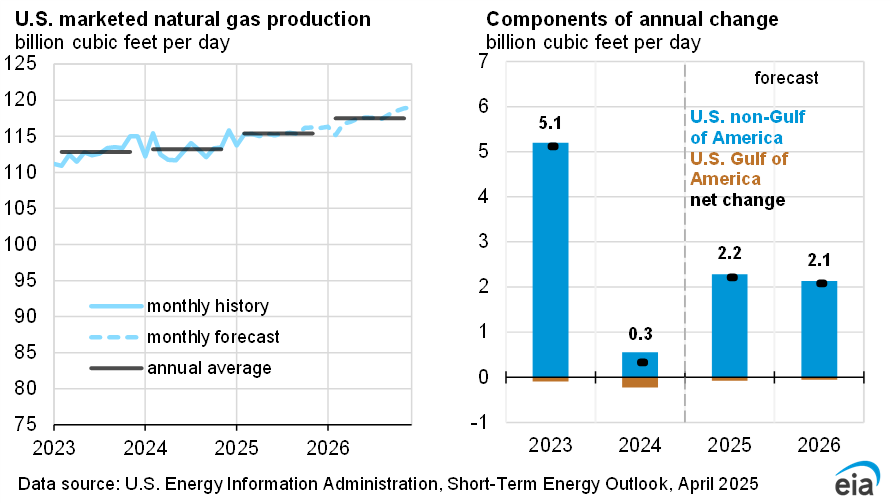
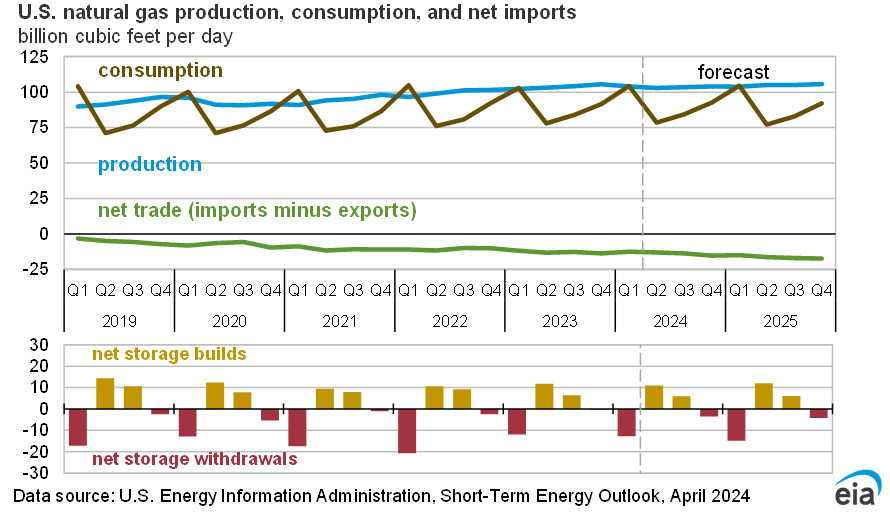
* EIA forecasts that annual U.S. dry natural gas production will average 92.1 billion cubic feet per day (Bcf/d) in 2019, up 10% from 2018. EIA expects that natural gas production will grow much less in 2020 because of the lag between changes in price and changes in future drilling activity. Low prices in the third quarter of 2019 will reduce natural gas-directed drilling in the first half of 2020. EIA forecasts natural gas production in 2020 will average 95.1 Bcf/d.....