http://www.realclearpolitics.com/articles/2015/05/19/the_gop_is_the_strongest_its_been_in_decades_126633.htmlThe GOP Is the Strongest It's Been in Decades
By Sean Trende & David Byler - May 19, 2015
Last fall, RCP Election Analyst David Byler and I put together an index of party strength. While most journalists look at presidential performance as a measure of party strength (see the ubiquitous “Republicans have lost the popular vote in five of the last six elections”), we take a broader view of party strength. Rather than look simply at presidential performance, we look at party dominance at the federal, congressional, and state levels. One need only look at fights over voter identification laws, redistricting, food stamp benefits, Obamacare expansion, and a multitude of other battles from the last few years alone to understand the importance of non-federal elections. We therefore believe this approach gives a more complete measure of party strength.
In this article, we do three things. First, we recap our methodology. Second, we update the methodology for 2014, and we look forward to 2016. Finally, we run some diagnostics on our index, answering various objections that have been raised.
Our index is the sum of five parts: presidential performance, House performance, Senate performance, gubernatorial performance and state legislative performance. The first is measured by the party’s performance in the previous presidential popular vote (NB: In this, and all other measurements, third parties are excluded).
House performance is the average of the popular vote for the House and the average of the share of the House won by the party. This helps mitigate the effects of gerrymandering. Senate performance is the share of the Senate held by the party.
Gubernatorial performance is the party’s share of governorships (again, with third party candidates excluded). We do not weight for population, for reasons explored further below. For state legislatures, we average four numbers: the share of state Houses and state Senates held by each party along with the share of state House seats and state Senate seats held by each party.
This gives us five metrics, all of which run on a scale from 0 to 100. Adding them together gives us a scale from 0 to 500. We then subtract 250 from the total. All this does is assign a score of zero to a situation where the parties are evenly matched, rather than 250. A positive score then means that the Republican Party is stronger while a negative score means the Democratic Party is stronger.
We ran the scale back to the founding of the Republican Party in 1856. The average score is -4 and the median is -6, suggesting that over time the parties have been pretty evenly matched. The low score for the Republicans came in 1936, when they hit a bottom of -119. Their strongest performance was 108 in 1866 (post-Reconstruction, their strongest performance was 79 in 1920). The standard deviation was 45.6 – in plain English, that means when a party rises above 45 it can be thought of as doing unusually well, and when it rises above 90 or so it is doing exceptionally well. About 60 percent of the results fall between -30 and 30.
Before the 2014 elections, the parties were pretty close to parity: The index stood at 7.98. This indicated an insignificant advantage for the Republicans, although it placed them well above their post-World War II average of -20.
It goes without saying that Republicans improved upon their showing in the 2014 elections. Their 54 Senate seats represent the second-best tally for the party since 1928. Their 247 House seats is the most the party has won since 1928, although when combined with the popular vote percentage, it drops to the second-highest since then (in 1946, the party did slightly better).
At the state level, the GOP’s share of governorships is the ninth-highest since Reconstruction, and the third-highest in the post-war era (1996 and 1998 were higher). The party’s showing in state legislatures is the highest since 1920, the ninth-highest ever, and the third-highest since the end of Reconstruction.
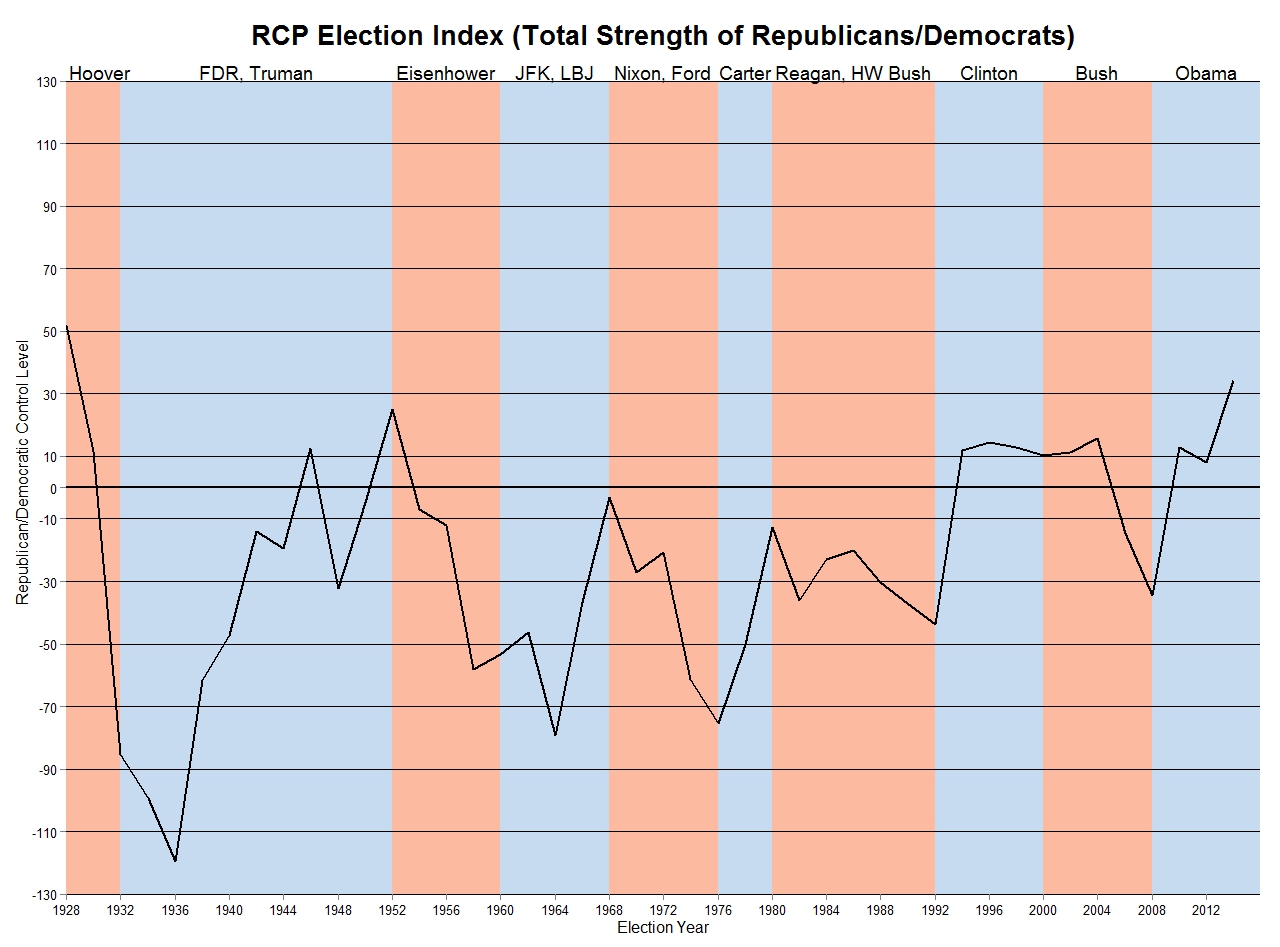
Overall, this gives the Republicans an index score of 33.8. This is the Republican Party’s best showing in the index since 1928, and marks only the third time that the party has been above 15 in the index since the end of World War II. You can see the full trend, taken back to 1928, here:
continued

