The Most Startling Chart of the Obama Era
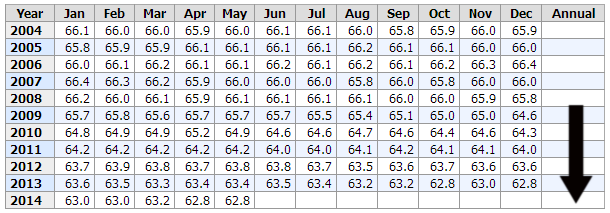
I happened to look at the official government statistics for the Labor Force Participation Rate. This is the percentage of adults 16 and over that are in the workforce.
I noticed something that I haven't heard others point out.
Take a look at the rate and walk down each column (each month) since January of 2009 when SCOAMF was first inaugurated.
Did you notice it?
Adjusted for seasonality, the labor force participation rate (LFR) has never increased -- not once -- under Obama! Normalized by month, the LFR has been on a non-stop ride to progressive Utopia (i.e., full unemployment).
This is a stunning repudiation of the Obama economic agenda. Stunning.
Mind you, this is the Obama administration's own set of statistics. Having confirmed that the White House routinely publishes fake economic statistics (e.g., "Census ‘faked’ 2012 election jobs report"), the true data may be even worse.
And what is this, the fourth or fifth annual Summer of Recovery©®™?
http://directorblue.blogspot.com/2014/06/the-most-startling-chart-of-obama-era.html

