http://dyn.realclearpolitics.com/printpage/?url=http://www.realclearpolitics.com/articles/2014/02/20/computing_democrats_risk_of_losing_the_senate_121640.html&showimages=1How Likely Are Dems to Lose the Senate?
By Sean Trende - February 20, 2014
A few weeks ago, I produced two Senate analyses. One focused on the relationship between the president’s job approval, the fate of Senate Democrats during the 2010 and 2012 elections, and what that would mean if this relationship continues through 2014. The second looked at Republican vulnerability in 2016 using a similar standard.
The first piece concluded that, based on President Obama’s job approval rating, Democrats have substantial vulnerability in 2014. This vulnerability is deeper than many analysts are willing to consider right now. Over the past two cycles, the president’s job approval has explained 58 percent of the variance in competitive Senate races in any given state. Given Obama’s current weak numbers, this seemingly bodes poorly for Democrats. Remember, the midterm map is the “reddest” Senate map Democrats have had to defend while Obama has been president. Their overexposure makes it something of a perfect storm scenario if things do not improve. This doesn’t mean that the problems are insuperable for Democrats. It simply means that the playing field is stacked heavily against them.
The second piece took a somewhat different tack. Instead of just looking at the playing field for 2016, it used that playing field as the basis for a simulation run in a neutral year to help better quantify Republican exposure. It concluded that unless 2016 turned out to be a good Republican year overall, that Republicans would probably have to win 53 or 54 seats in 2014 to feel good about their chances of holding the Senate two years later.
The present article takes the technique used in the second piece and applies it to the playing field described in the first. In other words, this is a “Monte Carlo simulation” to try to better quantify the amount of exposure Democrats are under this time.
First, a brief explanation of a Monte Carlo simulation is probably justified. As always, there are an awful lot of complexities and nuances that I can’t possibly fit into this piece. So just accept this as a starting point, to get a sense of what is going on. (I’ve bracketed the explanatory part with asterisks; if you’re not interested in understanding what’s going on, skip ahead.)
**
Monte Carlo techniques are varied, but at their root they involve generating a large number of random values within prescribed limits so we can assess the likelihood of a given outcome. For example, imagine a hypothetical situation where Democrats controlled a 50-50 Senate. Let’s also say that two Democratic incumbents were polling at 52 percent in polls with error margins of +/- five percentage points.
We want to know how often, statistically, the Democrats might be expected to win both seats and keep the Senate. Most contemporary analysts would approach this from one of two directions. Some analysts might note that Democrats led in both races, and should therefore feel extremely good about their chances. Others would note the error margins, label them both “coin tosses,” and call the battle for the Senate a tossup.
In fact, under these conditions Democrats would be solid, but not overwhelmingly solid, favorites to hold the upper chamber. Now, there is a mathematical way to answer this with precision, but it is complex and cumbersome, especially if there are 20 races to evaluate rather than two or if we need to simulate 10 variables instead of one. What we can do instead is to ask our program to produce random draws, centered on the two midpoints, with standard deviations that approximate half the error margins.
We then ask the program to generate some large number of draws, in this case 20,000. They will be centered around a mean of 52 percent for each Democrat, and 95 percent of the results will be within five points of that mean.
Democrats actually do well in each individual race: They win each one about 79 percent of the time. With that said, they only win both races 62 percent of the time. So even though both polls are technically “within the error margin,” Democrats should still be clear favorites to retain the Senate, although they should not be considered overwhelming favorites.
Notably, if we had three races with incumbents at 52 percent, we really would have a tossup Senate, with Democrats keeping it about 49 percent of the time. This is important: Even though each individual senator would be a 79 percent favorite to keep his or her seat, the odds would be slightly against the Democrats holding the chamber under these circumstances.
**
If this approach sounds familiar, it should. It is basically the one popularized by Nate Silver at FiveThirtyEight, although his models are substantially more complex. And indeed, there are a number of complexities you’d want to build into an important model.
For this experiment though -- and this is a really important caveat -- we’re just trying to get a ballpark estimate of the relationship between the playing field and the Democrats’ chances of holding each seat, as well as what that means for the overall picture. So we might say that, based on presidential job approval, Democrats have a 20 percent chance of holding a particular seat. This is notable, but we should remember that one time out of five, the Democrats really will hold the seat.
Some candidates seemingly have better chances for beating the odds than others; there really are instances where, because of challenger quality or incumbent quality or both, we might actually bet on this being that “one time.” Virginia is a case where I suspect Democrats’ chances are substantially better than the president’s approval might suggest, given Mark Warner’s strength. On the other hand, I think the Democrats’ chances in South Dakota are probably worse than the odds suggest, even at relatively high Obama job approvals. In theory these would cancel each other out, but not always; I think the model underestimates Republicans in 2016 and probably overestimates them here, especially with respect to their chances of making huge gains.
With that said, I first looked at races The Cook Political Report currently rates as something other than “safe”; over the past 20 years, only two races that Cook Political has rated as “safe” at this point in the game have wound up switching hands, so we can be awfully confident that those seats are “staying put.” That leaves me with a universe of 17 competitive Senate races, 15 of which are held by Democrats, two of which are held by Republicans.
Second, using the technique outlined in my first Senate piece, I estimated what the president’s job approval would be in these states for each incremental increase in national job approval from 38 to 55 percent.
Finally, for each job approval rating increment, I ran 20,000 simulations for each race. The president’s estimated approval is used as the midpoint, and almost all of the simulations are kept within 10 points of that midpoint (two reasons: 1) no Democrat in a competitive race, with the possible exception of Joe Manchin in 2010, has run more than 10 points ahead or behind the president’s job approval in their state; 2) if you run the regression of job approval vs. outcomes, the standard deviation is five).
You can click here to see how often an average Democrat would be expected to lose each individual race to an average Republican at each job approval interval.
The next step is to total up our simulations, showing how frequently Republicans would win the Senate at each job approval interval for Obama.

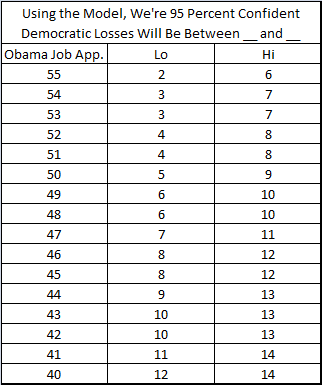
This is a grim picture for Senate Democrats, suggesting that the president would have to get his approval above 50 percent by Election Day before they would be favored to hold the chamber. This is also consistent with what we’ve seen in polling, which shows the seven “red state” Democrats in truly severe states of distress, while Democrats in Iowa, Michigan, New Hampshire and Colorado are exhibiting surprising weakness. If these 11 seats are showing similar signs of weakness in November, Democrats will have an extremely difficult time holding the chamber. At Obama’s current 44 percent approval rating, we’d expect Democrats to lose somewhere between nine and 13 seats.
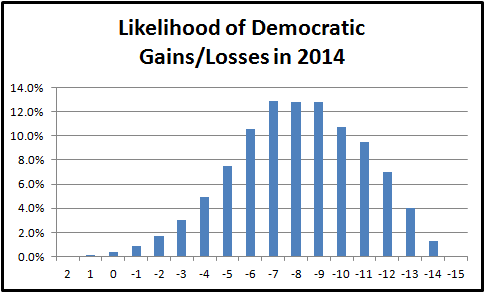
But let’s take it one step further. We’re probably right to be skeptical that Obama’s job approval will be, say, 55 percent on Election Day, just as it’s not likely to be 38 percent. Instead, let’s run simulations for his job approval. It has averaged 48.3 percent over his presidency, with a standard deviation of 4.35 percent. If we run our simulations around these values, we get the following overall distribution of outcomes:

Notably, there are situations where Democrats end up gaining seats. There are also, however, situations where the election turns into an absolute debacle for Democrats.
The most common outcome, however, is Democratic losses of between seven to nine seats. In about a third of the simulations there are more losses, and in about a third of the simulations, there are fewer.
Now, again, one might decide that, based on candidate quality and other issues, Democrats are poised to systematically end up on the high side of the probability calculus. I actually think this is probably correct. My general view is that this approach gets the odds right in the most commonly discussed races, especially since Republicans don’t seem poised to nominate weak candidates (for now). At the same time, though, weak Republican recruiting in places like Iowa and Minnesota, combined with unusually gifted Democratic incumbents in places like Virginia, probably means that the model overstates Democrats’ chances of losing more than eight seats.
One other possibility is that the relationship we’ve seen between job approval and Democratic outcomes won’t hold for this cycle. It’s been relatively strong over the past couple of elections, but that doesn’t mean it will continue. In fact, models that go back further in time give Democrats a much stronger chance of holding the Senate. My own sense is that, due to polarization, it now takes extremely unusual circumstances for a Democrat to win a state like Arkansas under a Democratic president (just as Lincoln Chafee couldn’t hold on in Rhode Island under a Republican president, despite being a very liberal Republican). But this might not hold true this year.
With all of that said, this is a very, very challenging map for Democrats. As things presently stand, the map probably makes them underdogs to hold the Senate. Barring some sort of change in the national environment or meltdown in the Republican nominations process -- neither of which is impossible -- Democrats are likely in for a very long night on Nov. 4.
//