Working natural gas storage capacity utilization reaches 80% or more in EIA’s three largest regions
https://www.eia.gov/naturalgas/storage/dashboard/commentary/20191004October 4, 2019
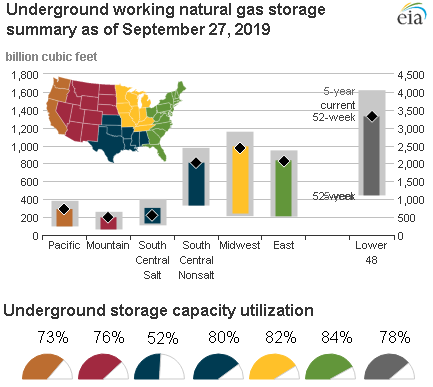
Weekly estimates of natural gas storage capacity utilization published on October 3, 2019, show the United States is at least 80% full in the three regions with the most working gas capacity—East, Midwest, and South Central non-salt, according to the latest EIA Natural Gas Storage Dashboard. These three regions accounted for more than 70% of the total working natural gas capacity in the Lower 48 states in 2018.
Estimated net injections into underground natural gas storage facilities for the Lower 48 states for the reporting week ending September 27 were 112 billion cubic feet (Bcf) and topped 100 Bcf for a second week in a row. This was the largest injection reported for a September week since at least 2010, when EIA started reporting stocks for five regions.
EIA’s storage capacity utilization fuel gauge chart shows that the East is 84% full, the Midwest is 82% full, and the nonsalt facilities in the South Central region are 80% full. Based on the most recent five-year averages regional capacity utilization at this point in the refill season has been 84% in the East, 80% in the Midwest, and 77% in the South Central nonsalt. Facilities in these regions are key to supporting seasonal withdrawals from storage to help meet peak-day natural gas demand.
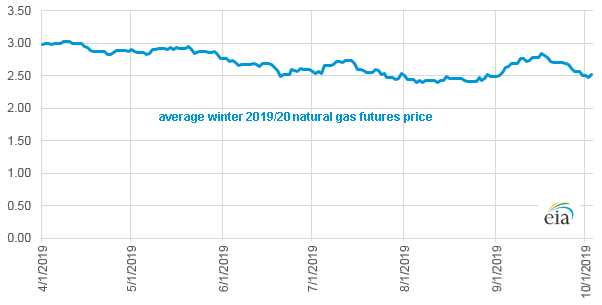
At the start of the summer injection season in early April, the average 2019–2020 natural gas storage futures price—an average of forward contract prices for the months November 2019 through March 2020—was about $3 per million British thermal units ($/MMBtu). The average price of natural gas futures for the upcoming winter dipped to less than $2.50/MMBtu mid-summer, rose to about $2.84/MMBtu in mid-September as a result of much warmer-than-normal temperatures, and has recently declined to about $2.50/MMBtu again. Contributing factors to the lower natural gas price expectations, on average, for the 2019–20 winter (see chart below) include
Record natural gas production
The National Oceanic and Atmospheric Administration’s December–February outlook indicating the likelihood of a warm winter in most of the United States
Lower 48 states’ natural gas stocks approaching the 5-year average
Average winter 2019/20 natural gas futures price at the Henry Hub since April 1, 2019
dollars per million British thermal units