EIA’s new interactive New England dashboard tracks energy capacity constraints
https://www.eia.gov/todayinenergy/detail.php?id=38092JANUARY 23, 2019
To increase customer understanding of weather-related energy issues in New England, EIA now has an interactive dashboard showing energy market conditions in that region.
The dashboard will help analysts and interested participants examine many key aspects of the New England energy market such as
Fuel diversification
Wholesale price volatility
Energy delivery dynamics
Weather's impact on operations
Fuel prices' effect on electricity prices
Regional and on-site fuel stocks
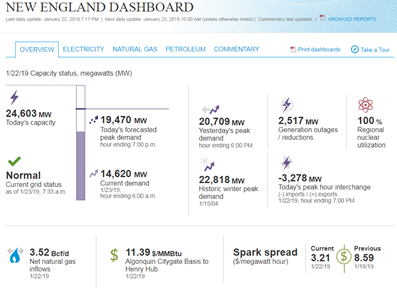
EIA will update the New England Dashboard every day by 10:30 a.m. Eastern Standard Time, including on weekends. The dashboard includes detailed regional information on temperatures; various fuel prices; locational marginal prices; the status of the electric grid, outages, and available capacity; current and projected load; liquefied natural gas (LNG) imports; electricity generation fuel mix; inter-regional electric transmission and natural gas flows; and petroleum product stocks.
Sources for the dashboard include both EIA and third-party data. Key series from third-party sources include actual and forecast temperatures from the National Oceanic and Atmospheric Administration (NOAA); various electric price, load, generation, interchange, operating statistics, and fuel mix information from the Independent System Operator New England (ISO-NE); natural gas demand, LNG imports, and natural gas pipeline flows from OPIS PointLogic; crude oil and petroleum product prices from Refinitiv; and spot natural gas and electricity prices from S&P Global Market Intelligence.
Dashboard users can
Select information by fuel
Choose customized time periods and other ranges for graphics
Display data contents on graphs
Animate temperature trends
Print the entire dashboard as well as individual visualizations
Download selected data series or images
Automate data transfer through access to real-time information Application Programming Interface calls
The commentary section will provide analysis of recent New England energy market conditions when a situation warrants more insight.
Energy delivery infrastructure constraints and outages can have a pronounced influence on New England’s wholesale energy prices, energy flows, and operations. As a result, the New England Dashboard illustrates these constraints, including
Nuclear generating capacity availability
Real-time locational marginal prices by ISO-NE zone and electric interface
Electric generation outages and reductions
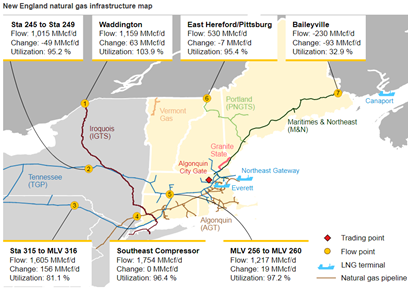
Interactive map indicating natural gas pipeline capacity use at key flow points affecting New England
- - - - - - - - - - - - - - - - - -
All of this so the New Englanders can know if they are freezing in their homes due to a lack of Pipelines, Power Plants, Power Lines or Fuel Oil. Any of which can be thanked by the NIMBYs and environMENTALists.

